Market Outlook
August 25, 2016
Market Cues
Domestic Indices
Chg (%)
(Pts)
(Close)
Indian markets are likely to open on a positive note tracking SGX Nifty.
BSE Sensex
0.2
70
28,060
Nifty
0.2
18
8,650
US markets moved lower on Wednesday due to losses in healthcare and material
stocks. Oil prices also moved sharply lower due to unexpectedly large supply
Mid Cap
0.6
79
13,024
buildup. The Federal Reserve had initially forecast rate hikes, but weak economic
Small Cap
0.7
81
12,515
growth and volatility has delayed tightening in monetary policy. The direction of any
Bankex
0.0
9
22,209
interest rates would be clearer after Federal Reserve chair Janet Yellen’s speech.
UK markets closed in the red after mixed earnings and a slide in commodity prices.
Global Indices
Chg (%)
(Pts)
(Close)
Mining company Glencore Plc reported a loss for the first half of the year.
Dow Jones
(0.4)
(66)
18,481
Commodity and energy stocks were down, while housing stocks were positive after
Nasdaq
(0.8)
(42)
5,218
positive data from the British Bankers Association.
FTSE
(0.5)
(33)
6,836
Indian markets ended Wednesday's session slightly higher in a choppy trading
Nikkei
0.6
100
16,597
session. Investors awaited the expiry of derivative contracts as well as the speech by
Hang Seng
(0.8)
(178)
22,821
the Federal Reserve Chairwoman, Janet Yellen. Energy and Pharma sectors were
Shanghai Com
(0.1)
(4)
3,086
the major gainers for the this trading session.
Result Review
Advances / Declines
BSE
NSE
Result Review: Aurobindo Pharma
Advances
1,532
948
Detailed analysis on Pg2
Declines
1,197
651
Investor’s Ready Reckoner
Unchanged
200
76
Key Domestic & Global Indicators
Stock Watch: Latest investment recommendations on 150+ stocks
Volumes (` Cr)
Refer Pg5 onwards
BSE
3,032
NSE
18,386
Top Picks
CMP
Target
Upside
Company
Sector
Rating
(`)
(`)
(%)
Net Inflows (` Cr)
Net
Mtd
Ytd
Amara Raja
Auto/Auto Ancillary
Buy
892
1,076
20.6
FII
6
7,950
38,833
HCL Tech
IT
Buy
787
1,000
27.1
MFs
131
350
9,138
HDFC Bank
Financials
Accumulate
1,262
1,350
7.0
Bharat Electronics
Capital Goods
Buy
1,228
1,414
15.1
Top Gainers
Price (`)
Chg (%)
Equitas Holdings
Financials
Buy
181
235
29.6
Jktyre
125
12.6
Navkar Corporation Others
Buy
197
265
34.5
More Top Picks on P3
Punjlloyd
22
9.8
Enginersin
251
8.3
Key Upcoming Events
Torntpharm
1,701
7.8
Previous
Consensus
Date
Region
Event Description
Reading
Expectations
Bfutilities
624
7.4
Aug 25 US
GDP Qoq (Annualised)
1.20
1.10
Aug 26 US
Initial Jobless claims
262.00
265.00
Top Losers
Price (`)
Chg (%)
Aug 26 UK
GDP (YoY)
2.20
2.20
Cub
129
(3.1)
Aug 30 Germany
Unemployment change (000's)
(7.00)
Renuka
16
(3.1)
Aug 30 Euro Zone
Euro-Zone Consumer Confidence
(8.50)
6.(
Shriramcit
2,171
(2.7)
More Events on Pg4
Oberoirlty
305
(2.7)
Escorts
317
(2.7)
As on August 24, 2016
Market Outlook
August 25, 2016
Result Review
Aurobindo Pharma (CMP: `736 / TP:`877 /Upside: 19.2%)
For 1QFY2017, sales came in at `3,664cr V/s `3,900cr expected V/s `3,320cr in
1QFY2016, a yoy growth of
10.3%, mainly driven by formulations. The
Formulation (`3,032cr), posted a yoy growth of 15.9%, constituting around 80% of
overall sales, while API (`735cr), posted a yoy growth of 1.6%. The US business
(which contributed 45% to the gross sales) witnessed 20.5% growth yoy in
1QFY2017. This is due to the new launches in the oral and injectable segment.
On the operating profit front, the EBITDA margins came in at 22.6% V/s 22.8%
expected V/s 21.8% in 1QFY2016, mainly driven by gross margin expansion
(55.3% in 1QFY2017 V/s 54.6% in 1QFY2016). Thus, the Adj. net profit came in
at `572cr V/s `576cr expected V/s `451cr in 1QFY2016.We maintain our buy
rating.
Y/E
Sales OPM
PAT
EPS ROE P/E P/BV EV/EBITDA EV/Sales
Mar
(` cr)
(%)
(` cr)
(`)
(%)
(x)
(x)
(x)
(x)
FY2017E
15,720
23.7
2,418
41.4
29.6
17.8
4.6
12.5
3.0
FY2018E
18,078
23.7
2,763
47.3
26.1
15.6
3.6
10.8
2.6
Economic and Political News
Cabinet approves National Highways Interconnectivity Improvement Project for
development of 1,120 kms of National worth `6,641cr
Railways gets approval for projects worth `24,374cr for expansion
Cabinet approves revised Double Tax Avoidance Agreement(DTAA) between
India and Cyprus
Corporate News
Reliance Power gets permission from Govt. to mortgage Sasan coal blocks
Lupin subsidiary gets permission to market generic Zyvox tablets
Reliance Communication launches enterprise cloud computing solution
Quarterly Bloomberg Brokers Consensus Estimate
Tata Motors Ltd Consol - Aug 26, 2016
Particulars (` cr)
1QFY17E
1QFY16
y-o-y (%)
4QFY16 q-o-q (%)
Net sales
63,783
60,181
6.0
79,926
(20.2)
EBITDA
8,656
9,109
(5.0)
11,387
(24.0)
EBITDA margin (%)
13.6
15.1
14.2
Net profit
2,416
2,769
(12.8)
4,573
(47.2)
DLF Ltd Consol - Aug 29, 2016
Particulars (` cr)
1QFY17E
1QFY16
y-o-y (%)
4QFY16 q-o-q (%)
Net sales
2,219
2,231
(0.6)
2,336
(5.0)
EBITDA
840
827
1.5
874
(3.9)
EBITDA margin (%)
37.9
37.1
37.4
Net profit
134
122
10.2
132
1.2
Market Outlook
August 25, 2016
Top Picks ★★★★★
Large Cap
Market Cap
CMP
Target
Upside
Company
Rationale
(` Cr)
(`)
(`)
(%)
To outpace battery industry growth due to better technological
Amara Raja Batteries
15,203
892
1,076
20.6
products leading to market share gains in both the automotive
OEM and replacement segments.
Uptick in defense capex by government, coupled with BELs
Bharat Electronics
29,294
787
1,000
27.1
strong market positioning, indicate good times ahead for BEL.
HCL Tech
1,11,330
1,262
1,350
7.0
Stock is trading at attractive valuations & factors all bad news.
Strong visibility for a robust 20% earnings trajectory, coupled
HDFC Bank
3,16,923
1,228
1,414
15.1
with high quality of earnings on account of high quality retail
business and strategic focus on highly rated corporates.
Back on the growth trend, expect a long term growth of 14% to
Infosys
2,38,710
181
235
29.6
be a US$20bn in FY2020.
Strong market positioning within the domestic AC markets to
Voltas
12,317
197
265
34.5
continue, EMP business set to revive
Source: Company, Angel Research
Mid Cap
Market Cap
CMP
Target
Upside
Company
Rationale
(` Cr)
(`)
(`)
(%)
Among the top 4 players in the consumer durables segment.
Bajaj Electricals
2,595
251
277
10.4
Improved profitability backed by turn around in E&P segment.
Strong order book lends earnings visibility.
Favourable outlook for the AC industry to augur well for
Cooling products business which is out pacing the market
Blue Star
4,629
487
527
8.3
growth. EMPPAC division's profitability to improve once
operating environment turns around.
Strong loan growth backed by diversified loan portfolio and
Equitas Holdings
6,077
181
235
29.6
adequate CAR. ROE & ROA likely to remain decent as risk of
dilution remains low. Attractive valuations considering growth.
Expectations of above average monsoon augurs well for
Goodyear India
1,241
545
631
15.9
Goodyear India as it derives ~50% of its turnover from farm
tyre segment.
Commencement of new projects, downtrend in the interest rate
IL&FS Transport
2,209
70
93
32.8
cycle, to lead to stock re-rating
Economic recovery to have favourable impact on advertising &
Jagran Prakashan
6,041
186
205
10.1
circulation revenue growth. Further, the acquisition of a radio business
(Radio City) would also boost the company`s revenue growth.
Speedier execution and speedier sales, strong revenue visibility
Mahindra Lifespace
1,796
438
522
19.3
in short-to-long run, attractive valuations
Massive capacity expansion along with rail advantage at ICD as
Navkar Corporation
2,856
197
265
34.5
well CFS augurs well for the company
Earnings boost on back of stable material prices and favourable
Radico Khaitan
1,278
97
125
29.1
pricing environment. Valuation discount to peers provides
additional comfort
Strong brands and distribution network would boost growth
Siyaram Silk Mills
1,116
1,218
1,347
10.6
going ahead. Stock currently trades at an inexpensive valuation.
Market leadership in Hindi news genre and no. 2 viewership
TV Today Network
1,765
300
363
21.0
ranking in English news genre, exit from the radio business, and
anticipated growth in ad spends by corporates to benefit the stock.
Source: Company, Angel Research
Market Outlook
August 25, 2016
Key Upcoming Events
Result Calendar
Date
Company
August 25, 2016 Jyoti Structures
August 26, 2016 Tata Motors, Abbott India
Source: Bloomberg, Angel Research
Global economic events release calendar
Bloomberg Data
Date
Time
Country Event Description
Unit
Period
Last Reported Estimated
Aug 25, 2016
6:00 PM
US
GDP Qoq (Annualised)
% Change 2Q S
1.20
1.10
Aug 26, 2016
6:00 PM
US
Initial Jobless claims
ThousandsAug 20
262.00
265.00
2:00 PM
UK
GDP (YoY)
% Change 2Q P
2.20
2.20
Aug 30, 2016
1:25 PM Germany Unemployment change (000's)
Thousands Aug
(7.00)
2:30 PM Euro ZoneEuro-Zone Consumer Confidence
Value Aug F
(8.50)
Aug 31, 2016
7:30 PM
US
Consumer Confidence S.A./ 1985=100 Aug
97.30
96.65
Sep 01, 2016
1:25 PM Germany
PMI Manufacturing
Value Aug F
53.60
2:00 PM
UK
PMI Manufacturing
Value Aug
48.20
6:30 AM
China
PMI Manufacturing
Value Aug
49.90
50.00
Sep 02, 2016
6:00 PM
US
Change in Nonfarm payrolls
Thousands Aug
255.00
180.00
6:00 PM
US
Unnemployment rate
% Aug
4.90
4.80
Source: Bloomberg, Angel Research
Market Outlook
August 25, 2016
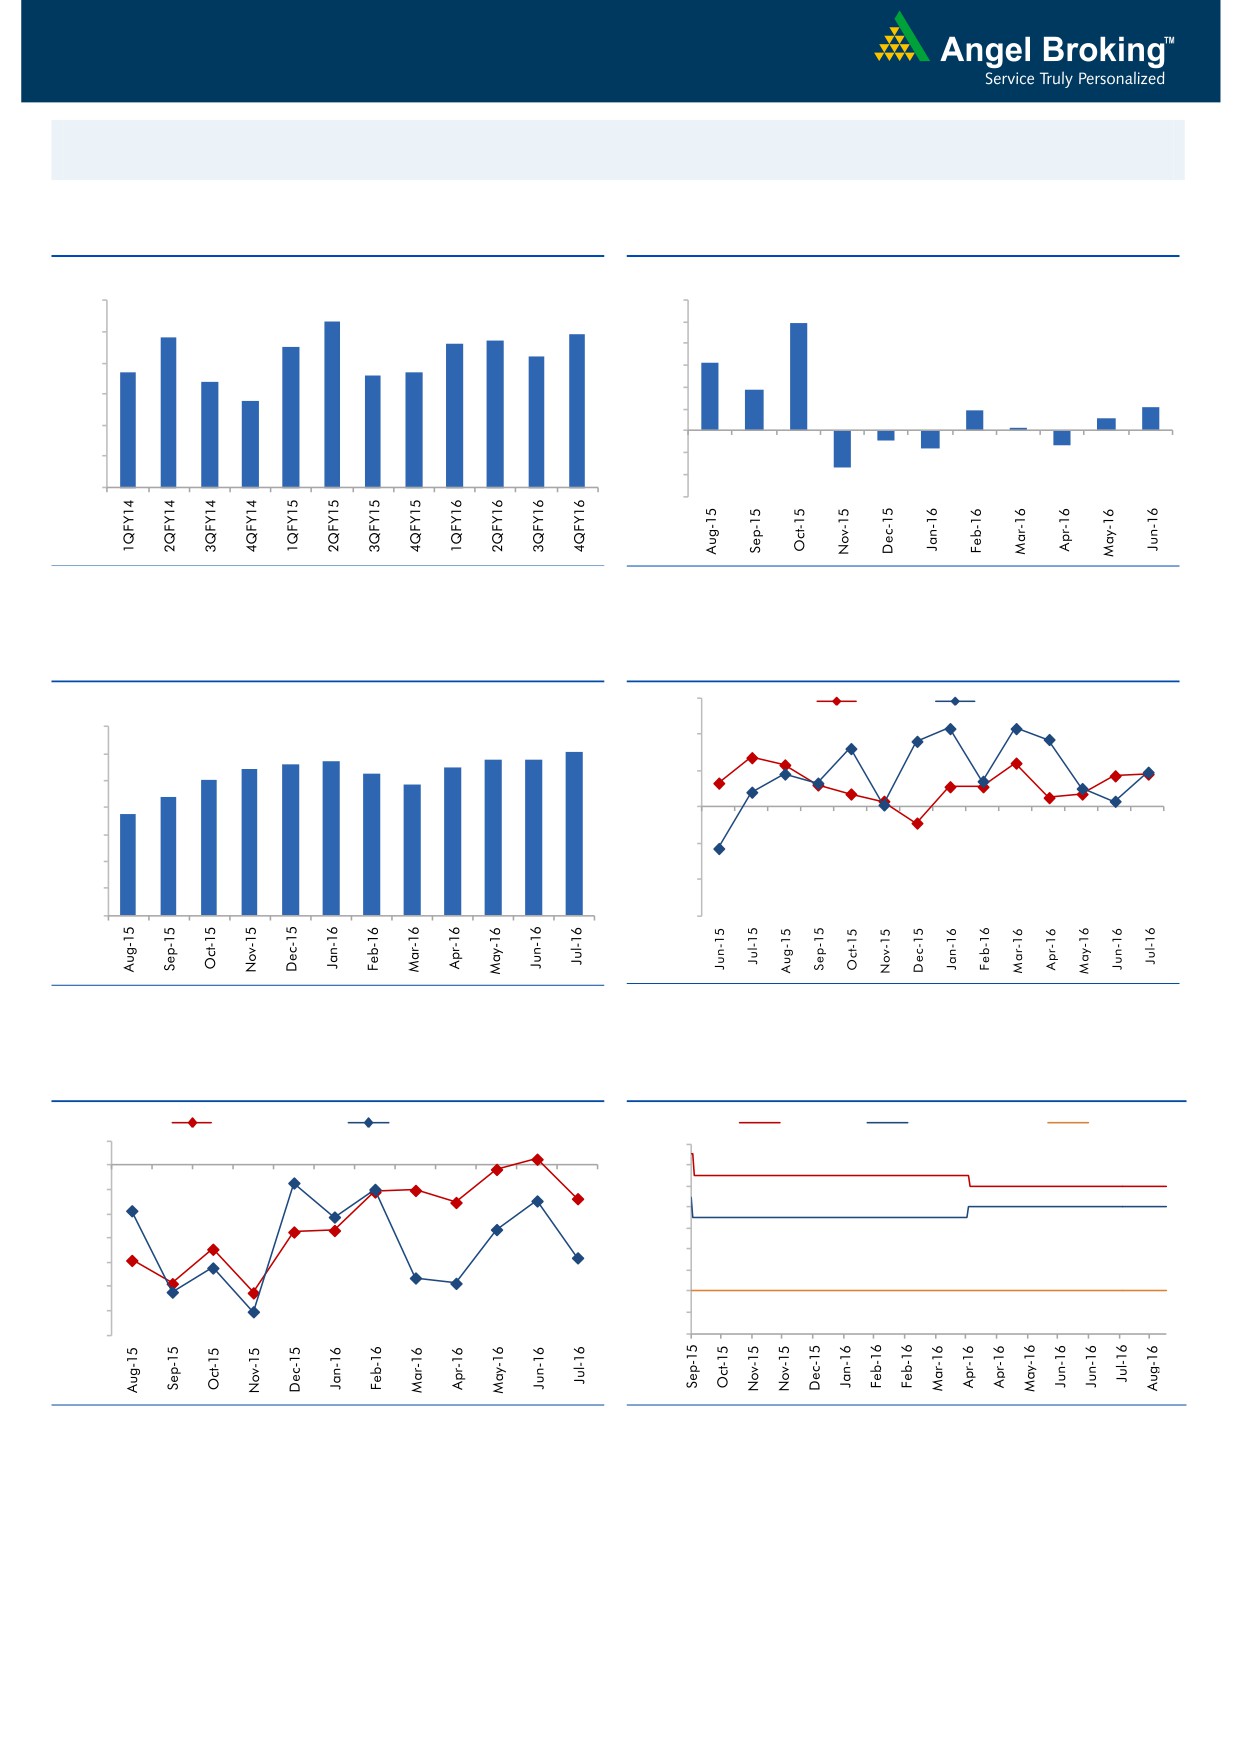
Macro watch
Exhibit 1: Quarterly GDP trends
Exhibit 2: IIP trends
(%)
(%)
9.0
8.3
12.0
9.9
7.8
7.7
7.9
10.0
8.0
7.5
7.6
7.2
8.0
6.3
6.7
6.6
6.7
7.0
6.4
6.0
3.7
5.8
4.0
2.1
6.0
1.9
1.1
2.0
0.3
5.0
-
4.0
(2.0)
(0.9)
(1.3)
(1.6)
(4.0)
3.0
(3.4)
(6.0)
Source: CSO, Angel Research
Source: MOSPI, Angel Research
Exhibit 3: Monthly CPI inflation trends
Exhibit 4: Manufacturing and services PMI
56.0
Mfg. PMI
Services PMI
(%)
7.0
6.1
54.0
5.6
5.7
5.8
5.8
5.4
5.5
6.0
5.3
5.0
4.8
52.0
5.0
4.4
3.7
4.0
50.0
3.0
48.0
2.0
46.0
1.0
-
44.0
Source: MOSPI, Angel Research
Source: Market, Angel Research; Note: Level above 50 indicates expansion
Exhibit 5: Exports and imports growth trends
Exhibit 6: Key policy rates
(%)
Exports yoy growth
Imports yoy growth
(%)
Repo rate
Reverse Repo rate
CRR
5.0
7.50
0.0
7.00
(5.0)
6.50
6.00
(10.0)
5.50
(15.0)
5.00
(20.0)
4.50
(25.0)
4.00
(30.0)
3.50
(35.0)
3.00
Source: Bloomberg, Angel Research
Source: RBI, Angel Research
Market Outlook
August 25, 2016
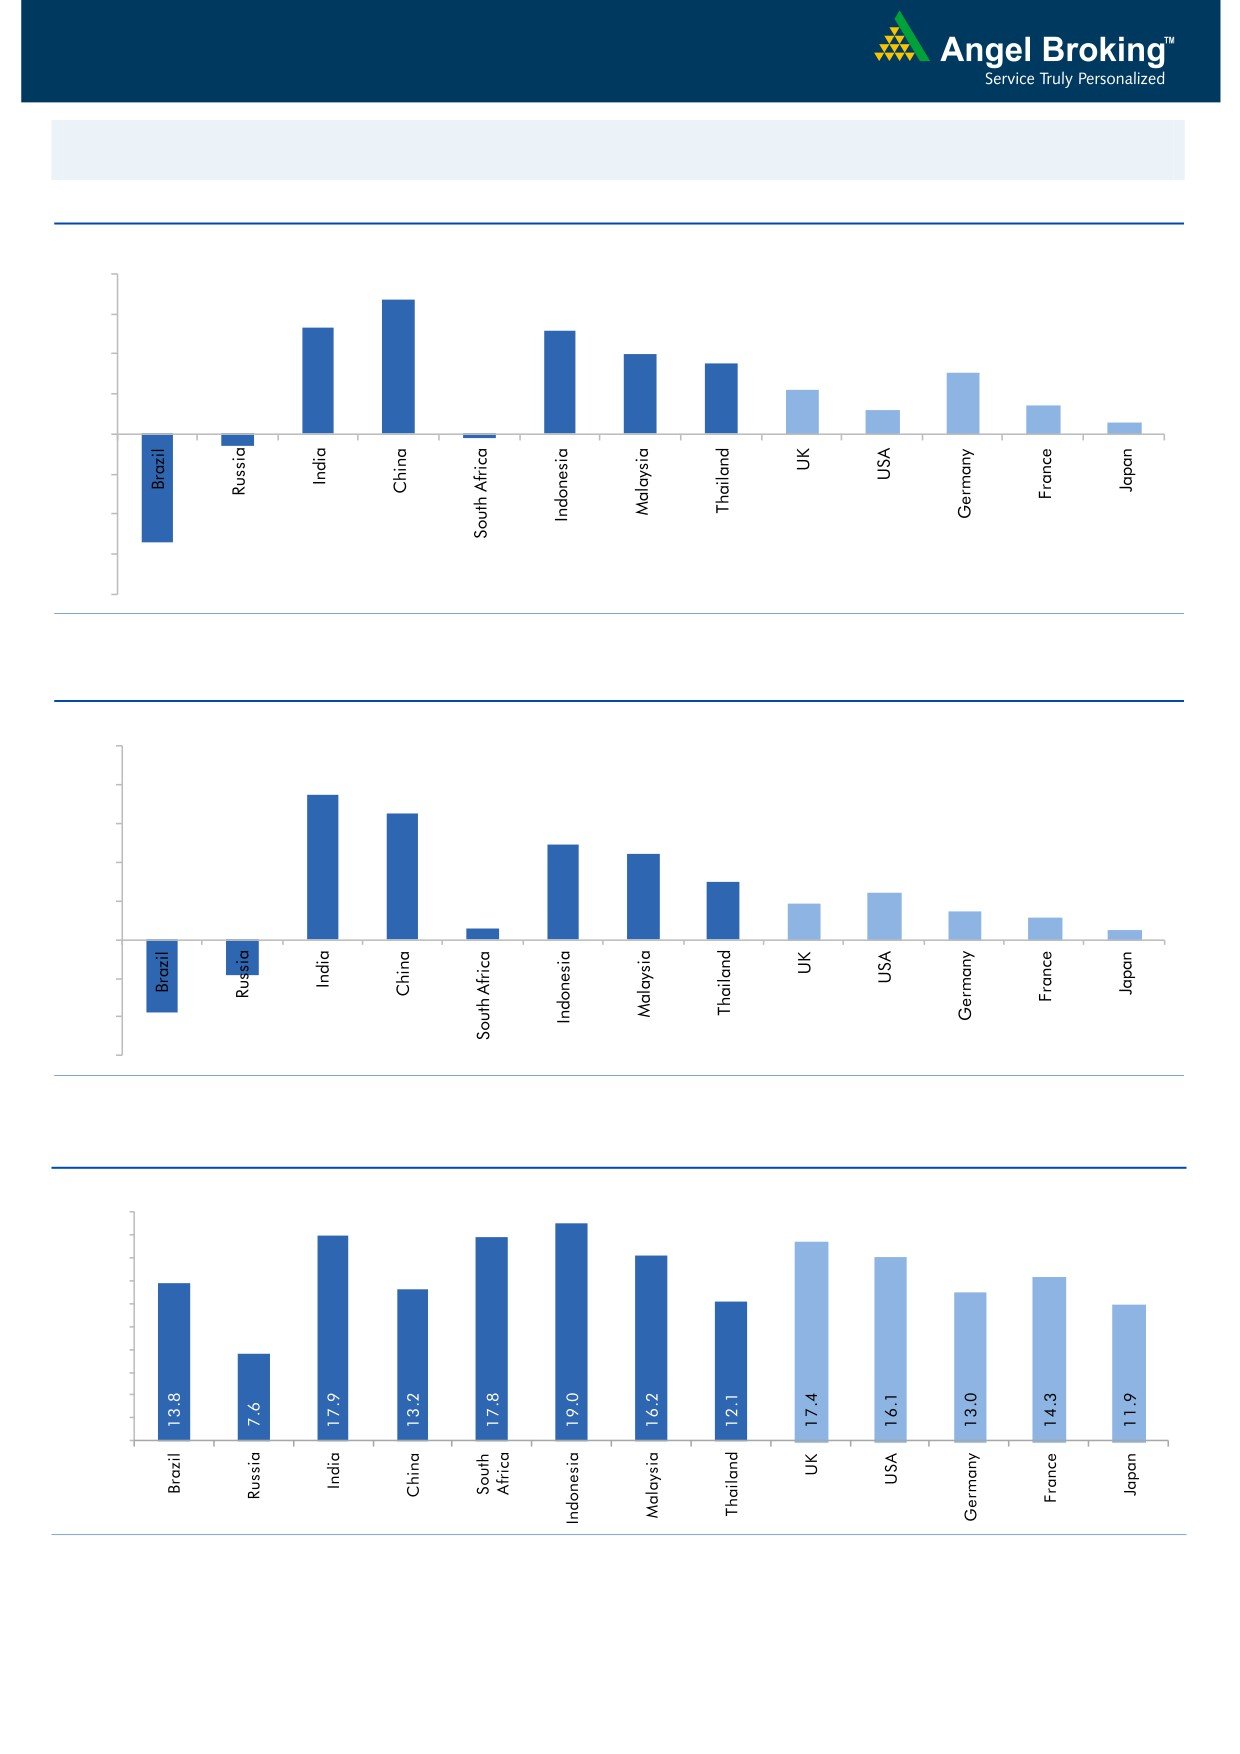
Global watch
Exhibit 1: Latest quarterly GDP Growth (%, yoy) across select developing and developed countries
(%)
8.0
6.7
6.0
5.3
5.2
4.0
3.5
4.0
3.1
2.2
2.0
1.2
1.4
0.6
-
(2.0)
(0.6)
(4.0)
(6.0)
(5.4)
(0.2)
(8.0)
Source: Bloomberg, Angel Research
Exhibit 2: 2016 GDP Growth projection by IMF (%, yoy) across select developing and developed countries
(%)
10.0
7.5
8.0
6.5
6.0
4.9
4.4
4.0
3.0
2.4
1.9
1.5
2.0
1.1
0.6
0.5
(3.8)
(1.8)
-
(2.0)
(4.0)
(6.0)
Source: IMF, Angel Research
Exhibit 3: One year forward P-E ratio across select developing and developed countries
(x)
20.0
18.0
16.0
14.0
12.0
10.0
8.0
6.0
4.0
2.0
-
Source: IMF, Angel Research
Market Outlook
August 25, 2016
Exhibit 4: Relative performance of indices across globe
Returns (%)
Country
Name of index
Closing price
1M
3M
1YR
Brazil
Bovespa
57,718
1.5
16.6
23.9
Russia
Micex
1,984
2.7
4.5
21.4
India
Nifty
8,650
1.3
11.6
2.0
China
Shanghai Composite
3,086
0.2
8.6
(23.5)
South Africa
Top 40
46,859
1.3
0.7
8.0
Mexico
Mexbol
47,744
1.3
3.7
12.8
Indonesia
LQ45
929
3.8
14.7
23.5
Malaysia
KLCI
1,682
0.8
2.9
7.0
Thailand
SET 50
986
2.8
11.6
7.3
USA
Dow Jones
18,481
(0.1)
4.4
13.5
UK
FTSE
6,836
1.9
9.1
10.4
Japan
Nikkei
16,597
(0.2)
0.6
(19.4)
Germany
DAX
10,623
4.2
3.4
3.2
France
CAC
4,435
1.1
(1.7)
(2.6)
Source: Bloomberg, Angel Research
Stock Watch
August 25, 2016
Company Name
Reco
CMP
Target
Mkt Cap
Sales ( Čcr )
OPM(%)
EPS (Č)
PER(x)
P/BV(x)
RoE(%)
EV/Sales(x)
(Č)
Price ( Č)
( Č cr )
FY17E FY18E
FY17E
FY18E
FY17E
FY18E
FY17E
FY18E
FY17E
FY18E
FY17E
FY18E
FY17E
FY18E
Agri / Agri Chemical
Rallis
Neutral
229
-
4,458
1,937
2,164
13.3
14.3
9.0
11.0
25.5
20.8
4.4
3.9
18.4
19.8
2.3
2.1
United Phosphorus
Accumulate
644
684
27,602
15,176
17,604
18.5
18.5
37.4
44.6
17.2
14.4
3.4
2.8
21.4
21.2
1.9
1.6
Auto & Auto Ancillary
Ashok Leyland
Buy
89
111
25,200
22,407
26,022
10.6
10.6
5.2
6.4
17.0
13.8
3.8
3.2
23.6
24.7
1.2
1.0
Bajaj Auto
Neutral
2,872
-
83,113
25,093
27,891
19.5
19.2
143.9
162.5
20.0
17.7
5.6
4.8
30.3
29.4
3.0
2.7
Bharat Forge
Neutral
856
-
19,928
7,726
8,713
20.5
21.2
35.3
42.7
24.3
20.1
4.5
4.1
18.9
20.1
2.6
2.3
Eicher Motors
Neutral
22,132
-
60,114
16,583
20,447
17.5
18.0
598.0
745.2
37.0
29.7
12.7
9.6
41.2
38.3
3.5
2.7
Gabriel India
Neutral
119
-
1,712
1,544
1,715
9.0
9.3
5.4
6.3
22.1
18.9
4.2
3.7
18.9
19.5
1.1
0.9
Hero Motocorp
Neutral
3,310
-
66,087
31,253
35,198
15.3
15.0
172.3
192.1
19.2
17.2
7.0
6.0
38.9
37.0
2.0
1.7
Jamna Auto Industries Neutral
222
-
1,769
1,486
1,620
9.8
9.9
15.0
17.2
14.8
12.9
3.2
2.7
21.8
21.3
1.3
1.1
L G Balakrishnan & Bros Neutral
461
-
724
1,302
1,432
11.6
11.9
43.7
53.0
10.6
8.7
1.5
1.4
13.8
14.2
0.6
0.6
Mahindra and Mahindra Neutral
1,435
-
89,149
46,534
53,077
11.6
11.7
67.3
78.1
21.3
18.4
3.5
3.0
15.4
15.8
1.9
1.6
Maruti
Neutral
4,949
-
149,502
69,186
82,217
14.7
14.4
198.5
241.4
24.9
20.5
4.9
3.9
20.2
20.0
1.9
1.5
Minda Industries
Neutral
1,274
-
2,021
2,728
3,042
9.0
9.1
68.2
86.2
18.7
14.8
4.2
3.4
23.8
24.3
0.8
0.7
Motherson Sumi
Neutral
325
-
43,002
45,896
53,687
7.8
8.3
13.0
16.1
24.9
20.2
8.0
6.4
34.7
35.4
1.0
0.8
Rane Brake Lining
Neutral
656
-
519
511
562
11.3
11.5
28.1
30.9
23.4
21.2
3.6
3.2
15.3
15.0
1.2
1.1
Setco Automotive
Neutral
46
-
613
741
837
13.0
13.0
15.2
17.0
3.0
2.7
0.5
0.5
15.8
16.3
1.2
1.1
Tata Motors
Neutral
498
-
143,783
300,209
338,549
8.9
8.4
42.7
54.3
11.7
9.2
1.9
1.6
15.6
17.2
0.6
0.5
TVS Motor
Accumulate
307
330
14,569
13,390
15,948
6.9
7.1
12.8
16.5
24.0
18.5
6.0
4.7
26.3
27.2
1.1
0.9
Amara Raja Batteries
Buy
892
1,076
15,236
5,717
6,733
18.7
18.9
38.4
48.9
23.3
18.2
5.8
4.7
25.3
24.8
2.5
2.1
Exide Industries
Neutral
175
-
14,867
7,439
8,307
15.0
15.0
8.1
9.3
21.6
18.8
3.0
2.7
14.3
16.7
1.6
1.4
Apollo Tyres
Accumulate
174
183
8,870
12,877
14,504
14.3
13.9
21.4
23.0
8.1
7.6
1.3
1.1
16.4
15.2
0.9
0.8
Ceat
Buy
868
1,119
3,511
7,524
8,624
13.0
12.7
131.1
144.3
6.6
6.0
1.2
1.0
19.8
18.6
0.5
0.5
JK Tyres
Neutral
125
-
2,831
7,455
8,056
15.0
15.0
21.8
24.5
5.7
5.1
1.2
1.0
22.8
21.3
0.5
0.4
Swaraj Engines
Neutral
1,151
-
1,429
660
810
15.2
16.4
54.5
72.8
21.1
15.8
6.6
6.0
31.5
39.2
2.0
1.6
Subros
Neutral
101
-
604
1,488
1,681
11.7
11.9
6.4
7.2
15.7
14.1
1.7
1.5
10.8
11.4
0.6
0.5
Indag Rubber
Neutral
173
-
454
286
326
19.8
16.8
11.7
13.3
14.8
13.0
2.5
2.3
17.8
17.1
1.3
1.1
Capital Goods
ACE
Neutral
43
-
423
709
814
4.1
4.6
1.4
2.1
30.5
20.4
1.3
1.2
4.4
6.0
0.8
0.7
BEML
Accumulate
1,036
1,157
4,313
3,451
4,055
6.3
9.2
31.4
57.9
33.0
17.9
2.0
1.8
6.3
10.9
1.4
1.2
Bharat Electronics
Buy
1,228
1,414
29,472
8,137
9,169
16.8
17.2
58.7
62.5
20.9
19.7
3.2
2.9
44.6
46.3
2.6
2.3
Stock Watch
August 25, 2016
Company Name
Reco
CMP
Target
Mkt Cap
Sales ( Čcr )
OPM(%)
EPS (Č)
PER(x)
P/BV(x)
RoE(%)
EV/Sales(x)
(Č)
Price ( Č)
( Č cr )
FY17E
FY18E
FY17E
FY18E
FY17E
FY18E
FY17E
FY18E
FY17E
FY18E
FY17E
FY18E
FY17E
FY18E
Capital Goods
Voltas
Accumulate
388
407
12,823
6,511
7,514
7.9
8.7
12.9
16.3
30.0
23.8
5.4
4.7
16.7
18.5
1.7
1.5
BGR Energy
Neutral
114
-
825
16,567
33,848
6.0
5.6
7.8
5.9
14.7
19.4
0.8
0.8
4.7
4.2
0.2
0.1
BHEL
Neutral
137
-
33,471
28,797
34,742
-
2.8
2.3
6.9
59.5
19.8
1.0
1.0
1.3
4.8
0.8
0.6
Blue Star
Accumulate
487
527
4,639
4,351
5,024
6.4
7.1
17.2
20.6
28.3
23.6
18.4
15.4
23.1
24.1
1.1
1.0
Crompton Greaves
Neutral
86
-
5,418
5,777
6,120
5.9
7.0
3.3
4.5
26.2
19.2
1.2
1.1
4.4
5.9
0.9
0.8
Greaves Cotton
Neutral
134
-
3,272
1,755
1,881
16.8
16.9
7.8
8.5
17.2
15.8
3.4
3.2
20.6
20.9
1.6
1.4
Inox Wind
Buy
189
286
4,203
5,605
6,267
15.7
16.4
24.8
30.0
7.6
6.3
2.1
1.6
25.9
24.4
0.8
0.7
KEC International
Neutral
136
-
3,495
9,294
10,186
7.9
8.1
9.9
11.9
13.7
11.4
2.0
1.8
15.6
16.3
0.6
0.6
Thermax
Neutral
837
-
9,976
5,421
5,940
7.3
7.3
25.7
30.2
32.6
27.7
3.9
3.6
12.2
13.1
1.7
1.6
VATech Wabag
Buy
572
681
3,116
3,136
3,845
8.9
9.1
26.0
35.9
22.0
15.9
2.8
2.3
13.4
15.9
0.9
0.7
Cement
ACC
Neutral
1,648
-
30,950
11,225
13,172
13.2
16.9
44.5
75.5
37.0
21.8
3.5
3.2
11.2
14.2
2.8
2.4
Ambuja Cements
Neutral
267
-
53,037
9,350
10,979
18.2
22.5
5.8
9.5
46.1
28.1
3.9
3.5
10.2
12.5
5.7
4.8
India Cements
Neutral
145
-
4,451
4,364
4,997
18.5
19.2
7.9
11.3
18.3
12.8
1.3
1.3
8.0
8.5
1.8
1.6
JK Cement
Neutral
784
-
5,482
4,398
5,173
15.5
17.5
31.2
55.5
25.1
14.1
3.0
2.6
12.0
15.5
1.8
1.5
J K Lakshmi Cement
Neutral
452
-
5,319
2,913
3,412
14.5
19.5
7.5
22.5
60.3
20.1
3.7
3.1
12.5
18.0
2.4
2.0
Orient Cement
Neutral
173
-
3,544
2,114
2,558
18.5
20.5
8.1
11.3
21.4
15.3
3.2
2.7
9.0
14.0
2.3
1.8
UltraTech Cement
Neutral
3,820
-
104,827
25,768
30,385
21.0
23.5
111.0
160.0
34.4
23.9
4.4
3.8
13.5
15.8
4.2
3.5
Construction
ITNL
Buy
70
93
2,304
8,946
10,017
31.0
31.6
8.1
9.1
8.7
7.7
0.3
0.3
4.2
5.0
3.6
3.3
KNR Constructions
Neutral
703
-
1,977
1,210
1,595
15.4
16.0
33.9
52.1
20.7
13.5
3.2
2.8
13.6
18.0
1.7
1.2
Larsen & Toubro
Buy
1,473
1,700
137,285
67,665
77,249
10.7
11.5
57.3
71.2
25.7
20.7
2.4
2.2
12.6
14.3
2.2
1.9
Gujarat Pipavav Port
Neutral
172
-
8,315
705
788
52.2
51.7
5.0
5.6
34.4
30.7
3.4
3.0
11.2
11.2
11.4
9.8
MBL Infrastructures
Buy
115
285
476
2,797
3,405
14.7
15.4
21.0
34.8
5.5
3.3
0.6
0.5
11.0
16.2
0.8
0.8
Nagarjuna Const.
Neutral
86
-
4,773
8,842
9,775
9.1
8.8
5.3
6.4
16.2
13.4
1.3
1.2
8.2
9.1
0.7
0.6
PNC Infratech
Accumulate
121
129
3,105
2,350
2,904
13.4
13.7
48.0
42.0
2.5
2.9
0.5
0.4
16.8
13.2
1.4
1.2
Simplex Infra
Neutral
300
-
1,484
6,829
7,954
10.5
10.5
31.4
37.4
9.6
8.0
1.0
0.9
9.9
13.4
0.6
0.5
Power Mech Projects
Neutral
465
-
684
1,801
2,219
12.7
14.6
72.1
113.9
6.5
4.1
1.2
1.0
16.8
11.9
0.4
0.3
Sadbhav Engineering
Accumulate
283
298
4,856
3,598
4,140
10.3
10.6
9.0
11.9
31.5
23.8
3.3
2.9
9.9
11.9
1.6
1.4
NBCC
Neutral
240
-
14,415
7,428
9,549
7.9
8.6
8.2
11.0
29.3
21.8
1.5
1.2
28.2
28.7
1.7
1.2
MEP Infra
Neutral
44
-
714
1,877
1,943
30.6
29.8
3.0
4.2
14.7
10.5
7.1
4.8
0.6
0.6
1.8
1.6
Stock Watch
August 25, 2016
Company Name
Reco
CMP
Target
Mkt Cap
Sales ( Čcr )
OPM(%)
EPS (Č)
PER(x)
P/BV(x)
RoE(%)
EV/Sales(x)
(Č)
Price ( Č)
( Č cr )
FY17E
FY18E
FY17E
FY18E
FY17E
FY18E
FY17E
FY18E
FY17E
FY18E
FY17E
FY18E
FY17E
FY18E
Construction
SIPL
Neutral
97
-
3,417
1,036
1,252
65.5
66.2
(8.4)
(5.6)
3.6
4.2
(22.8)
(15.9)
11.5
9.6
Engineers India
Neutral
251
-
8,464
1,725
1,935
16.0
19.1
11.4
13.9
22.0
18.1
3.0
2.9
13.4
15.3
3.8
3.4
Financials
Axis Bank
Neutral
584
-
139,303
58,081
66,459
3.5
3.5
32.4
44.6
18.0
13.1
2.4
2.1
13.6
16.5
-
-
Bank of Baroda
Neutral
163
-
37,592
19,980
23,178
1.8
1.8
11.5
17.3
14.2
9.4
1.6
1.3
8.3
10.1
-
-
Canara Bank
Neutral
271
-
14,715
15,225
16,836
1.8
1.8
14.5
28.0
18.7
9.7
1.3
1.0
5.8
8.5
-
-
Dewan Housing Finance Neutral
282
-
8,229
2,225
2,688
2.9
2.9
29.7
34.6
9.5
8.2
1.5
1.3
16.1
16.8
-
-
Equitas Holdings
Buy
181
235
6,082
939
1,281
11.7
11.5
5.8
8.2
31.3
22.1
2.7
2.4
10.9
11.5
-
-
Federal Bank
Neutral
68
-
11,641
9,353
10,623
2.9
2.9
4.4
5.8
15.4
11.7
1.5
1.3
9.5
11.0
-
-
HDFC
Neutral
1,384
-
218,845
11,475
13,450
3.4
3.4
45.3
52.5
30.6
26.4
5.9
5.2
20.2
20.5
-
-
HDFC Bank
Accumulate
1,262
1,350
319,556
46,097
55,433
4.5
4.5
58.4
68.0
21.6
18.6
3.8
3.2
18.8
18.6
-
-
ICICI Bank
Neutral
249
-
144,783
39,029
45,903
3.3
3.3
16.7
16.3
14.9
15.3
1.8
1.7
10.1
12.4
-
-
LIC Housing Finance
Neutral
555
-
28,011
3,712
4,293
2.6
2.5
39.0
46.0
14.2
12.1
2.7
2.3
19.9
20.1
-
-
Punjab Natl.Bank
Neutral
126
-
24,800
23,532
23,595
2.3
2.4
6.8
12.6
18.6
10.0
2.9
2.0
3.3
6.5
-
-
South Ind.Bank
Neutral
23
-
3,065
6,435
7,578
2.5
2.5
2.7
3.1
8.4
7.3
1.1
0.9
10.1
11.2
-
-
St Bk of India
Neutral
255
-
197,679
88,650
98,335
2.6
2.6
13.5
18.8
18.9
13.6
1.8
1.6
7.0
8.5
-
-
Union Bank
Neutral
136
-
9,342
13,450
14,925
2.3
2.3
25.5
34.5
5.3
3.9
0.8
0.7
7.5
10.2
-
-
Yes Bank
Neutral
1,339
-
56,353
8,978
11,281
3.3
3.4
74.0
90.0
18.1
14.9
3.4
2.9
17.0
17.2
-
-
FMCG
Asian Paints
Neutral
1,119
-
107,334
17,128
18,978
16.8
16.4
19.1
20.7
58.6
54.1
20.4
19.2
34.8
35.5
6.2
5.6
Britannia
Neutral
3,436
-
41,228
9,795
11,040
14.6
14.9
80.3
94.0
42.8
36.6
17.6
13.6
41.2
-
4.1
3.6
Colgate
Neutral
949
-
25,798
4,605
5,149
23.4
23.4
23.8
26.9
39.9
35.3
22.1
17.3
64.8
66.8
5.5
4.9
Dabur India
Neutral
294
-
51,701
8,315
9,405
19.8
20.7
8.1
9.2
36.3
32.0
10.1
8.4
31.6
31.0
5.9
5.2
GlaxoSmith Con*
Neutral
6,245
-
26,265
4,350
4,823
21.2
21.4
179.2
196.5
34.9
31.8
9.3
7.8
27.1
26.8
5.4
4.8
Godrej Consumer
Neutral
1,535
-
52,274
10,235
11,428
18.4
18.6
41.1
44.2
37.4
34.7
8.3
7.0
24.9
24.8
5.2
4.6
HUL
Neutral
919
-
198,992
35,252
38,495
17.6
17.4
20.4
21.9
45.0
42.0
37.0
32.4
82.2
77.3
5.5
5.0
ITC
Accumulate
250
283
302,012
40,059
44,439
39.0
39.2
9.1
10.1
27.5
24.8
7.5
6.6
27.2
26.5
7.0
6.3
Marico
Neutral
291
-
37,576
6,430
7,349
18.8
19.5
6.4
7.7
45.5
37.8
13.7
11.6
33.2
32.5
5.7
4.9
Nestle*
Neutral
6,825
-
65,799
10,073
11,807
20.7
21.5
124.8
154.2
54.7
44.3
22.5
20.2
34.8
36.7
6.3
5.4
Tata Global
Neutral
140
-
8,852
8,675
9,088
9.8
9.8
7.4
8.2
19.0
17.1
2.2
2.1
7.9
8.1
0.9
0.9
Procter & Gamble
Accumulate
6,807
7,369
22,097
2,939
3,342
23.2
23.0
146.2
163.7
46.6
41.6
104.3
100.0
25.3
23.5
7.1
6.1
Hygiene
Stock Watch
August 25, 2016
Company Name
Reco
CMP
Target
Mkt Cap
Sales ( Čcr )
OPM(%)
EPS (Č)
PER(x)
P/BV(x)
RoE(%)
EV/Sales(x)
(Č)
Price ( Č)
( Č cr )
FY17E FY18E
FY17E
FY18E
FY17E
FY18E
FY17E
FY18E
FY17E
FY18E
FY17E
FY18E
FY17E
FY18E
IT
HCL Tech^
Buy
787
1,000
110,998
49,242
57,168
20.5
20.5
55.7
64.1
14.1
12.3
2.9
2.2
20.3
17.9
2.1
1.7
Infosys
Buy
1,058
1,370
242,913
69,934
79,025
27.5
27.5
64.8
72.0
16.3
14.7
3.6
3.3
22.0
22.3
2.9
2.5
TCS
Buy
2,572
3,004
506,774
121,684
136,286
27.3
27.3
135.0
150.1
19.1
17.1
6.3
5.8
33.2
33.9
3.9
3.5
Tech Mahindra
Buy
467
700
45,337
30,347
33,685
17.0
17.0
37.5
41.3
12.5
11.3
2.7
2.3
21.8
20.7
1.2
1.0
Wipro
Buy
520
680
128,440
51,631
55,822
21.7
17.9
35.9
36.9
14.5
14.1
3.0
2.8
19.0
18.1
2.2
2.0
Media
D B Corp
Neutral
407
-
7,484
2,297
2,590
27.4
28.2
21.0
23.4
19.4
17.4
4.5
3.9
23.7
23.1
3.1
2.6
HT Media
Neutral
79
-
1,845
2,693
2,991
12.6
12.9
7.9
9.0
10.0
8.8
0.9
0.8
7.8
8.3
0.3
0.1
Jagran Prakashan
Accumulate
186
205
6,089
2,355
2,635
28.0
28.0
9.9
10.8
18.8
17.3
3.7
3.2
21.7
21.7
2.6
2.3
Sun TV Network
Neutral
463
-
18,250
2,850
3,265
70.1
71.0
26.2
30.4
17.7
15.2
4.5
4.0
24.3
25.6
6.0
5.1
Hindustan Media
Neutral
275
-
2,020
1,016
1,138
24.3
25.2
27.3
30.1
10.1
9.1
1.9
1.7
16.2
15.8
1.3
1.1
Ventures
TV Today Network
Buy
300
363
1,789
637
743
27.5
27.5
18.4
21.4
16.3
14.0
2.8
2.4
17.4
17.2
2.4
2.0
Metals & Mining
Coal India
Neutral
334
-
210,935
84,638
94,297
21.4
22.3
24.5
27.1
13.6
12.3
5.7
5.4
42.6
46.0
2.0
1.8
Hind. Zinc
Neutral
228
-
96,189
14,252
18,465
55.9
48.3
15.8
21.5
14.4
10.6
2.4
2.1
17.0
20.7
6.8
5.2
Hindalco
Neutral
157
-
32,400
107,899
112,095
7.4
8.2
9.2
13.0
17.1
12.1
0.8
0.8
4.8
6.6
0.8
0.8
JSW Steel
Neutral
1,759
-
42,518
53,201
58,779
16.1
16.2
130.6
153.7
13.5
11.4
1.8
1.6
14.0
14.4
1.6
1.4
NMDC
Neutral
109
-
43,077
6,643
7,284
44.4
47.7
7.1
7.7
15.3
14.1
1.3
1.3
8.8
9.2
4.3
3.8
SAIL
Neutral
50
-
20,547
47,528
53,738
(0.7)
2.1
(1.9)
2.6
19.1
0.5
0.5
(1.6)
3.9
1.3
1.2
Vedanta
Neutral
176
-
52,179
71,744
81,944
19.2
21.7
13.4
20.1
13.1
8.8
1.1
1.0
8.4
11.3
1.1
0.8
Tata Steel
Neutral
380
-
36,921
121,374
121,856
7.2
8.4
18.6
34.3
20.4
11.1
1.3
1.2
6.1
10.1
0.9
0.9
Oil & Gas
Cairn India
Neutral
206
-
38,557
9,127
10,632
4.3
20.6
8.8
11.7
23.4
17.6
0.8
0.7
3.3
4.2
5.7
4.7
GAIL
Neutral
366
-
46,395
56,220
65,198
9.3
10.1
27.1
33.3
13.5
11.0
1.2
1.2
9.3
10.7
1.0
0.9
ONGC
Neutral
241
-
206,059
137,222
152,563
15.0
21.8
19.5
24.1
12.4
10.0
1.1
1.0
8.5
10.1
1.8
1.6
Indian Oil Corp
Neutral
564
-
136,973
373,359
428,656
5.9
5.5
54.0
59.3
10.5
9.5
1.6
1.5
16.0
15.6
0.5
0.4
Reliance Industries
Neutral
1,021
-
330,973
301,963
358,039
12.1
12.6
87.7
101.7
11.6
10.0
1.2
1.1
10.7
11.3
1.6
1.3
Pharmaceuticals
Alembic Pharma
Neutral
640
-
12,061
3,483
4,083
20.2
21.4
24.3
30.4
26.3
21.1
6.0
4.8
25.5
25.3
3.4
2.8
Aurobindo Pharma
Accumulate
788
877
46,085
15,720
18,078
23.7
23.7
41.4
47.3
19.0
16.7
4.9
3.9
29.6
26.1
3.2
2.7
Aventis*
Neutral
4,311
-
9,929
2,357
2,692
17.3
17.3
153.5
169.2
28.1
25.5
4.8
3.9
25.8
28.4
3.9
3.2
Cadila Healthcare
Accumulate
377
400
38,554
11,126
13,148
22.0
22.0
17.1
20.0
22.0
18.8
5.7
4.5
28.8
26.6
3.5
2.8
Cipla
Reduce
566
490
45,474
15,378
18,089
17.4
18.4
21.6
27.2
26.2
20.8
3.4
3.0
13.7
15.2
3.2
2.6
Stock Watch
August 25, 2016
Company Name
Reco
CMP
Target
Mkt Cap
Sales ( Čcr )
OPM(%)
EPS (Č)
PER(x)
P/BV(x)
RoE(%)
EV/Sales(x)
(Č)
Price ( Č)
( Č cr )
FY17E FY18E
FY17E
FY18E
FY17E
FY18E
FY17E
FY18E
FY17E
FY18E
FY17E
FY18E
FY17E
FY18E
Pharmaceuticals
Dr Reddy's
Neutral
3,039
-
51,829
16,043
18,119
23.1
24.7
126.0
157.8
24.1
19.3
3.6
3.1
15.7
17.1
3.2
2.8
Dishman Pharma
Sell
174
45
2,805
1,718
1,890
22.7
22.8
9.5
11.3
18.3
15.4
1.8
1.6
10.1
10.9
2.1
1.8
GSK Pharma*
Neutral
3,047
-
25,812
3,528
3,811
16.6
18.8
51.8
59.4
58.8
51.3
15.7
15.7
26.3
30.6
7.1
6.6
Indoco Remedies
Sell
317
225
2,925
1,112
1,289
18.2
18.2
13.2
15.6
24.1
20.4
4.3
3.6
19.2
19.2
2.7
2.4
Ipca labs
Accumulate
544
613
6,861
3,303
3,799
15.3
15.3
17.3
19.7
31.4
27.6
2.7
2.5
9.1
9.4
2.2
1.9
Lupin
Buy
1,521
1,809
68,577
15,912
18,644
26.4
26.7
58.1
69.3
26.2
22.0
5.1
4.2
21.4
20.9
4.4
3.6
Sun Pharma
Buy
771
944
185,472
31,129
35,258
30.0
30.9
28.0
32.8
27.5
23.5
4.2
3.5
18.7
18.9
5.5
4.7
Power
Tata Power
Neutral
76
-
20,677
36,916
39,557
17.4
27.1
5.1
6.3
15.0
12.1
1.3
1.2
9.0
10.3
1.6
1.4
NTPC
Neutral
161
-
132,958
86,605
95,545
17.5
20.8
11.8
13.4
13.7
12.0
1.4
1.3
10.5
11.1
2.9
2.9
Power Grid
Neutral
182
-
95,450
25,763
29,762
74.3
73.1
14.8
17.3
12.3
10.6
1.9
1.7
16.9
17.5
8.0
7.6
Real Estate
MLIFE
Buy
438
522
1,796
1,152
1,300
22.7
24.6
29.9
35.8
14.6
12.2
1.1
1.0
7.6
8.6
2.3
1.9
Telecom
Bharti Airtel
Neutral
353
-
140,948
105,086
114,808
34.5
34.7
12.2
16.4
28.9
21.5
2.0
1.8
6.8
8.4
2.3
2.0
Idea Cellular
Neutral
98
-
35,360
40,133
43,731
37.2
37.1
6.4
6.5
15.3
15.1
1.3
1.2
8.2
7.6
1.9
1.6
zOthers
Abbott India
Neutral
4,684
-
9,954
3,153
3,583
14.1
14.4
152.2
182.7
30.8
25.6
151.1
129.1
25.6
26.1
2.9
2.5
Bajaj Electricals
Accumulate
251
277
2,535
5,099
5,805
5.7
5.9
11.4
14.6
22.1
17.2
3.0
2.6
13.4
15.1
0.5
0.4
Finolex Cables
Neutral
433
-
6,618
2,883
3,115
12.0
12.1
14.2
18.6
30.5
23.3
16.2
14.2
15.8
14.6
2.0
1.8
Goodyear India*
Buy
545
631
1,256
1,598
1,704
10.4
10.2
49.4
52.6
11.0
10.4
50.9
44.7
18.2
17.0
0.5
61.8
Hitachi
Neutral
1,540
-
4,188
2,081
2,433
8.8
8.9
33.4
39.9
46.1
38.6
37.2
31.0
22.1
21.4
2.0
1.7
Jyothy Laboratories
Neutral
295
-
5,341
1,440
2,052
11.5
13.0
8.5
10.0
34.7
29.5
8.4
7.8
18.6
19.3
4.0
2.8
Page Industries
Neutral
14,258
-
15,903
2,450
3,124
20.1
17.6
299.0
310.0
47.7
46.0
317.5
242.4
47.1
87.5
6.5
5.2
Relaxo Footwears
Neutral
461
-
5,532
2,085
2,469
9.2
8.2
7.6
8.0
61.0
58.0
23.6
20.2
17.9
18.8
2.7
2.3
Siyaram Silk Mills
Accumulate
1,218
1,347
1,142
1,799
2,040
11.6
11.7
104.9
122.4
11.6
10.0
1.9
1.6
16.4
16.4
0.9
0.8
Styrolution ABS India*
Neutral
580
-
1,020
1,440
1,537
9.2
9.0
40.6
42.6
14.3
13.6
36.5
33.2
12.3
11.6
0.7
0.6
TVS Srichakra
Buy
2,522
2,932
1,931
2,304
2,614
13.7
13.8
231.1
266.6
10.9
9.5
283.3
223.1
33.9
29.3
0.8
0.7
HSIL
Neutral
363
-
2,625
2,384
2,515
15.8
16.3
15.3
19.4
23.7
18.7
23.6
20.3
7.8
9.3
1.3
1.2
Kirloskar Engines India
Neutral
280
-
4,049
2,554
2,800
9.9
10.0
10.5
12.1
26.7
23.1
11.2
10.5
10.7
11.7
1.2
1.1
Ltd
M M Forgings
Neutral
424
-
511
546
608
20.4
20.7
41.3
48.7
10.3
8.7
58.0
51.4
16.6
17.0
0.8
0.7
Banco Products (India)
Neutral
221
-
1,579
1,353
1,471
12.3
12.4
14.5
16.3
15.2
13.6
21.0
19.0
14.5
14.6
1.1
119.0
Competent Automobiles Neutral
191
-
118
1,137
1,256
3.1
2.7
28.0
23.6
6.8
8.1
36.8
33.3
14.3
11.5
0.1
0.1
Stock Watch
August 25, 2016
Company Name
Reco
CMP
Target
Mkt Cap
Sales ( Čcr )
OPM(%)
EPS (Č)
PER(x)
P/BV(x)
RoE(%)
EV/Sales(x)
(Č)
Price ( Č)
( Č cr )
FY17E
FY18E
FY17E
FY18E
FY17E
FY18E
FY17E
FY18E
FY17E
FY18E
FY17E
FY18E
FY17E
FY18E
zOthers
Nilkamal
Neutral
1,243
-
1,855
1,995
2,165
10.7
10.4
69.8
80.6
17.8
15.4
71.0
61.7
16.6
16.5
0.9
0.8
Visaka Industries
Neutral
163
-
259
1,051
1,138
10.3
10.4
21.0
23.1
7.8
7.1
21.0
19.6
9.0
9.2
0.5
0.5
Transport Corporation of
Neutral
363
-
2,781
2,671
2,911
8.5
8.8
13.9
15.7
26.2
23.2
3.6
3.2
13.7
13.8
1.1
1.1
India
Elecon Engineering
Accumulate
56
63
613
1,482
1,660
13.7
14.5
3.9
5.8
14.4
9.7
3.4
3.1
7.8
10.9
0.7
0.6
Surya Roshni
Accumulate
175
201
769
3,342
3,625
7.8
7.5
17.3
19.8
10.2
8.9
19.3
15.5
10.5
10.8
0.5
0.4
MT Educare
Neutral
146
-
580
366
417
17.7
18.2
9.4
10.8
15.5
13.5
3.5
3.0
22.2
22.3
1.5
1.3
Radico Khaitan
Buy
97
125
1,288
1,659
1,802
13.0
13.2
6.3
7.4
15.3
13.1
1.3
1.2
8.6
9.3
1.2
1.1
Garware Wall Ropes
Neutral
505
-
1,105
873
938
12.9
13.1
30.9
34.9
16.3
14.5
2.6
2.2
15.7
15.2
1.2
1.1
Wonderla Holidays
Neutral
412
-
2,328
287
355
38.0
40.0
11.3
14.2
36.5
29.0
5.2
4.6
21.4
23.9
7.8
6.3
Linc Pen & Plastics
Neutral
288
-
426
382
420
9.3
9.5
13.5
15.7
21.4
18.3
3.7
3.2
17.1
17.3
1.2
1.1
The Byke Hospitality
Neutral
160
-
642
287
384
20.5
20.5
7.6
10.7
21.1
15.0
4.4
3.6
20.7
23.5
2.3
1.7
Interglobe Aviation
Neutral
879
-
31,672
21,122
26,005
14.5
27.6
110.7
132.1
7.9
6.7
47.5
33.9
168.5
201.1
1.5
1.2
Coffee Day Enterprises
Neutral
252
-
5,199
2,964
3,260
20.5
21.2
4.7
8.0
-
31.5
2.9
2.7
5.5
8.5
2.2
1.9
Ltd
Navneet Education
Neutral
104
-
2,476
1,062
1,147
24.0
24.0
6.1
6.6
17.1
15.7
3.5
3.1
20.6
19.8
2.4
2.2
Navkar Corporation
Buy
197
265
2,810
408
612
42.9
42.3
6.8
11.5
29.1
17.1
2.0
1.8
6.9
10.5
7.8
5.2
UFO Moviez
Neutral
483
-
1,334
619
685
33.2
33.4
30.0
34.9
16.1
13.9
2.2
1.9
13.8
13.9
1.9
1.5
VRL Logistics
Neutral
300
-
2,735
1,902
2,119
16.7
16.6
14.6
16.8
20.6
17.8
4.5
4.0
21.9
22.2
1.6
1.4
Team Lease Serv.
Neutral
1,125
-
1,923
3,229
4,001
1.5
1.8
22.8
32.8
49.4
34.3
5.3
4.6
10.7
13.4
0.5
0.4
S H Kelkar & Co.
Neutral
296
-
4,274
1,036
1,160
15.1
15.0
6.1
7.2
48.4
41.2
5.2
4.7
10.7
11.5
4.0
3.5
Quick Heal
Neutral
240
-
1,680
408
495
27.3
27.0
7.7
8.8
31.0
27.3
2.9
2.9
9.3
10.6
3.3
2.7
Narayana Hrudaya
Neutral
318
-
6,500
1,873
2,166
11.5
11.7
2.6
4.0
120.3
80.2
7.4
6.7
6.1
8.3
3.6
3.1
Manpasand Bever.
Neutral
717
-
3,588
836
1,087
19.6
19.4
16.9
23.8
42.4
30.1
5.1
4.5
12.0
14.8
4.0
3.0
Parag Milk Foods
Neutral
316
-
2,659
1,919
2,231
9.3
9.6
9.5
12.9
33.5
24.4
5.2
4.3
15.5
17.5
1.5
1.3
Source: Company, Angel Research; Note: *December year end; #September year end; &October year end; Price as on August 24, 2016
Market Outlook
August 25, 2016
Research Team Tel: 022 - 39357800
DISCLAIMER
Angel Broking Private Limited (hereinafter referred to as “Angel”) is a registered Member of National Stock Exchange of India
Limited,Bombay Stock Exchange Limited and Metropolitan Stock Exchange Limited. It is also registered as a Depository Participant with
CDSL and Portfolio Manager with SEBI. It also has registration with AMFI as a Mutual Fund Distributor. Angel Broking Private Limited is a
registered entity with SEBI for Research Analyst in terms of SEBI (Research Analyst) Regulations, 2014 vide registration number
INH000000164. Angel or its associates has not been debarred/ suspended by SEBI or any other regulatory authority for accessing
/dealing in securities Market. Angel or its associates/analyst has not received any compensation / managed or
co-managed public offering of securities of the company covered by Analyst during the past twelve months.
This document is solely for the personal information of the recipient, and must not be singularly used as the basis of any investment
decision. Nothing in this document should be construed as investment or financial advice. Each recipient of this document should make
such investigations as they deem necessary to arrive at an independent evaluation of an investment in the securities of the companies
referred to in this document (including the merits and risks involved), and should consult their own advisors to determine the merits and
risks of such an investment.
Reports based on technical and derivative analysis center on studying charts of a stock's price movement, outstanding positions and
trading volume, as opposed to focusing on a company's fundamentals and, as such, may not match with a report on a company's
fundamentals. Investors are advised to refer the Fundamental and Technical Research Reports available on our website to evaluate the
contrary view, if any.
The information in this document has been printed on the basis of publicly available information, internal data and other reliable
sources believed to be true, but we do not represent that it is accurate or complete and it should not be relied on as such, as this
document is for general guidance only. Angel Broking Pvt. Limited or any of its affiliates/ group companies shall not be in any way
responsible for any loss or damage that may arise to any person from any inadvertent error in the information contained in this report.
Angel Broking Pvt. Limited has not independently verified all the information contained within this document. Accordingly, we cannot
testify, nor make any representation or warranty, express or implied, to the accuracy, contents or data contained within this document.
While Angel Broking Pvt. Limited endeavors to update on a reasonable basis the information discussed in this material, there may be
regulatory, compliance, or other reasons that prevent us from doing so.
This document is being supplied to you solely for your information, and its contents, information or data may not be reproduced,
redistributed or passed on, directly or indirectly.
Neither Angel Broking Pvt. Limited, nor its directors, employees or affiliates shall be liable for any loss or damage that may arise from
or in connection with the use of this information.